Estimation of calculation accuracy for ionospheric maps
Root mean square deviation (RMS) of other ionospheric maps in relation to the Global Ionospheric Map by Information and Analysis Center for Positioning, Navigation and Timing IAC PNT (rapid IACG) for , in TECu
Root mean square deviation of other ionospheric maps in relation to the Global Ionospheric Map by Center for Orbit Determination in Europe (rapid CORG) for , in TECu
Root mean square deviation of other ionospheric maps in relation to the Global Ionospheric Map by Information and Analysis Center for Positioning, Navigation and Timing IAC PNT (rapid IACG) for depending on longitude, in TECu
Root mean square deviation of other ionospheric maps in relation to the Global Ionospheric Map by Center for Orbit Determination in Europe (rapid CORG) for depending on longitude, in TECu
Sources
| Map | Description | Link |
|---|---|---|
| IACG | Rapid Global Ionospheric Map, Information and Analysis Center for Positioning, Navigation and Timing IAC PNT | glonass-iac.ru |
| CORG | Rapid Global Ionospheric Map, Center for Orbit Determination in Europe | www.aiub.unibe.ch |
| WHRG | Rapid Global Ionospheric Map, Wuhan University WHU | www.igs.gnsswhu.cn/ |
| JPRG | Rapid Global Ionospheric Map, NASA Jet Propulsion Laboratory JPL | www.jpl.nasa.gov/ |
| GPSG | GPS broadcast Global Ionospheric Map (Klobuchar model) | |
| GALG | GALILEO broadcast Global Ionospheric Map (NeQuick model) | |
| BDSG | BeiDou-3 broadcast Global Ionospheric Map (BDGIM model) | |
| GLOG | GLONASS-K broadcast Global Ionospheric Map |
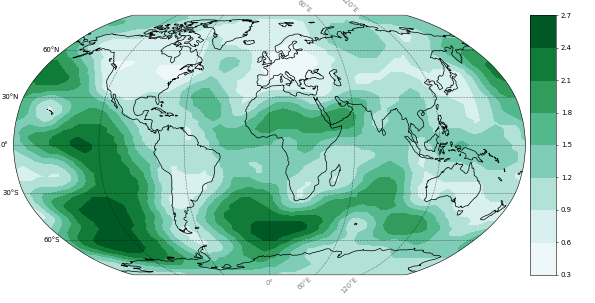
Distribution of estimated RMS errors for the Global Ionospheric Map by Information and Analysis Center for Positioning, Navigation and Timing IAC PNT (rapid IACG), in TECu

Ionospheric maps comparison method
VTEC Global Ionospheric Maps (vertical total electron content) are estimated at different analysis centers using different methods and source data. However, VTEC maps can be represented with the standard IONEX format in grid points form:
- for latitudes from +87.5° to –87.5° with a step of 2.5°,
- for longitudes from –180° to +180° with a step of 5° (total 5183 values),
- time resolution - from 00:00 to 00:00 of the next day with 1 hour or 2 hours steps (25 or 13 data sets).
To assess an accuracy of one map in relation to another, standard deviation of all values from IONEX files for a daily interval is calculated with the exception of a bias (the difference of average VTEC values).
\[ \begin{cases} bias_{IACG-CORG} = \langle VTEC_{IACG} \rangle - \langle VTEC_{CORG} \rangle\\ \\ STD_{IACG-CORG} = \sqrt{ \langle (VTEC_{IACG} - VTEC_{CORG} - bias_{IACG-CORG})^2 \rangle} \end{cases} \]
where \(VTEC_{IACG}\) and \(VTEC_{CORG}\) - values from IONEX, \( \langle \rangle \) - average calculating operation.


 Испытания НАП, оценка условий спутниковой навигации
 Ионосфера
 Принципы навигации
 Стандарт эксплуатационных характеристик открытого сервиса